← Back to Projects

Global Coffee Health Dataset

Can your daily coffee predict your stress level?

Using exploratory data analysis, statistical testing, and machine learning, our team analyzed a global dataset to investigate whether coffee consumption is associated with stress and other health outcomes.

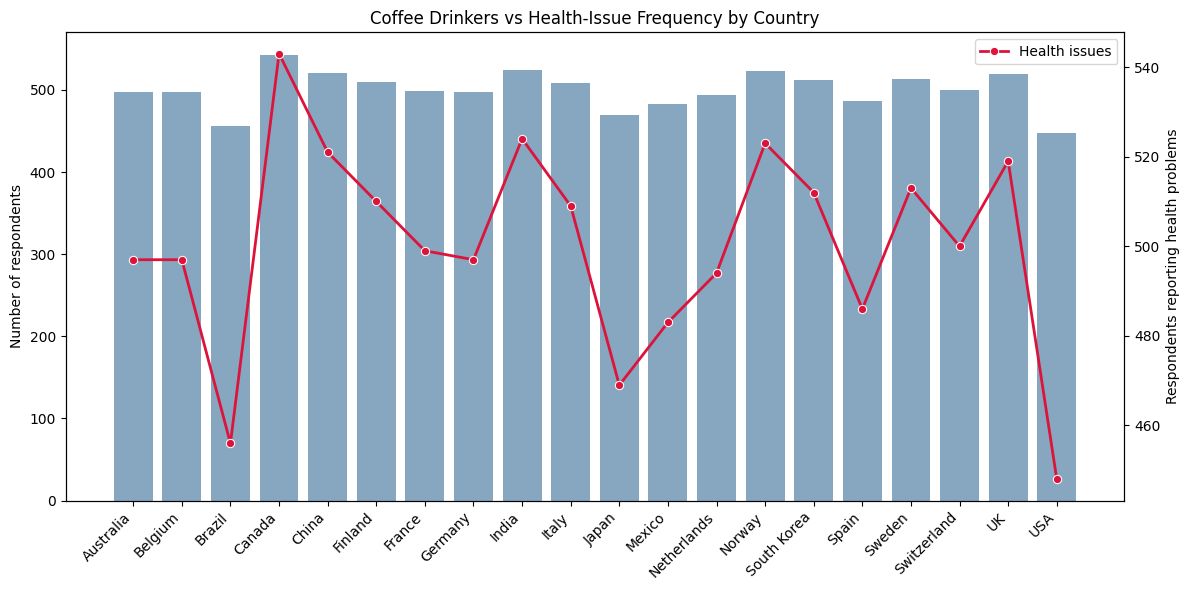
Chart comparing coffee drinkers and health-issue frequency across 20 countries
Role
Data Analyst
Course
SI 385 - Data Exploration
Timeline
August - December 2025
Team size
6 students
Dataset
Kaggle
Records
10,000
Countries
20

01 · Overview

A daily ritual with global reach.

Background

Coffee is one of the world's most consumed beverages, influencing daily habits, productivity, and health. Because caffeine affects sleep, energy, and stress, understanding these relationships can help individuals, healthcare professionals, and the coffee industry make more informed decisions.

02 · Problem statement

Is coffee really responsible?

Many people believe that drinking more coffee causes higher stress. However, evidence is limited on whether coffee itself is responsible or whether factors such as sleep quality and health play a much larger role.
Research question

Does coffee consumption have a statistically significant relationship with stress and other health indicators?

Project goal

Combine multiple forms of evidence

We brought together exploratory data analysis, statistical testing, regression, machine learning, and data visualization to test one central claim.

03 · Dataset

10,000 lives. 20 countries. 16 variables.

10,000Participants
20Countries
16Variables
Coffee habitsStressSleepBMIHealthLifestyle

Source: Kaggle's Global Coffee Health Dataset. The dataset captures coffee habits, health, sleep, BMI, and lifestyle variables across a broad international sample.

04 · My contributions

Working from raw data to a clear story.

01

Data Cleaning

Prepared, transformed, and standardized the dataset for analysis.

02

Exploratory Analysis

Identified trends through summary statistics and visualizations.

03

Statistical Analysis

Applied hypothesis testing and regression models.

04

Machine Learning

Built and evaluated an XGBoost classifier.

05

Data Visualization

Created visualizations with Seaborn and Matplotlib.

06

Team Collaboration

Interpreted results and communicated findings with teammates.

05 · Process

From raw data to insight.

  1. 01

    Research

    Reviewed literature on coffee consumption and health outcomes.

  2. 02

    Data Cleaning

    Filled missing values, converted categories, created a cups-of-coffee feature, and standardized data types.

  3. 03

    Exploratory Analysis

    Used descriptive statistics, a correlation matrix, boxplots, and distribution analysis.

  4. 04

    Statistical Analysis

    Applied a Chi-Square test, Cramér's V, and OLS regression.

  5. 05

    Machine Learning

    Evaluated XGBoost with cross-validation, a confusion matrix, a classification report, and feature importance.

  6. 06

    Visualization

    Designed charts that made comparisons and model evidence understandable.

  7. 07

    Conclusions

    Synthesized evidence into practical findings and recommendations.

06 · Tools

🐍 Python🐼 Pandas📊 Matplotlib📈 Seaborn🤖 XGBoost📉 Statsmodels🔍 SHAP📓 Jupyter

07 · Key visualizations

Three views. One consistent conclusion.

Bar and line chart comparing respondents and health issues by country
01 · Country comparison

Compared coffee consumption and reported health issues across 20 countries to identify broad geographic trends.

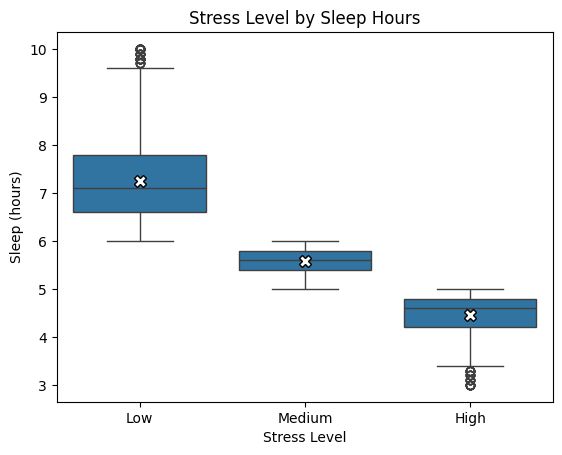
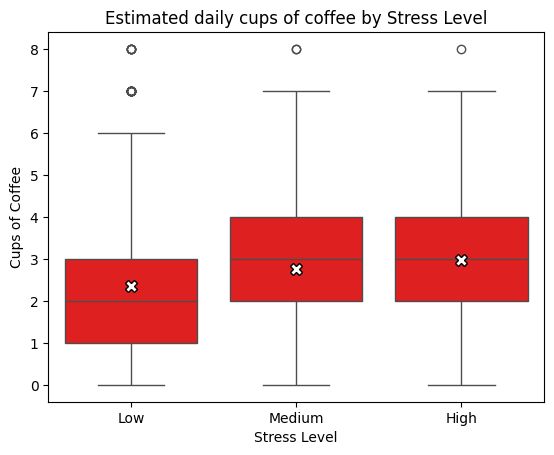
Boxplot of daily coffee cups by stress levelBoxplot of sleep hours by stress level
02 · Stress vs. sleep

Sleep duration decreased consistently as stress increased, suggesting a much stronger relationship than coffee consumption.

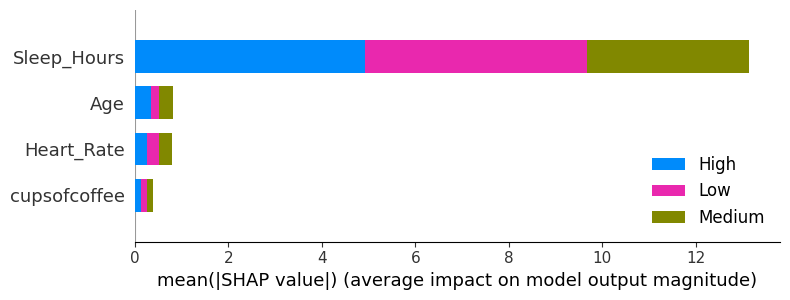
SHAP feature importance chart showing sleep hours as the strongest predictor of stress
03 · Feature importance

Machine learning confirmed that sleep, age, and heart rate contributed far more to stress prediction than coffee consumption.

08 · Key findings

10,000Participants
20Countries
82%XGBoost accuracy
CoffeeNot a significant predictor

The XGBoost model achieved about 82% accuracy, while coffee ranked among the least important predictors compared with sleep-related variables.

09 · Challenges

Making careful choices at every step.

Missing Data

More than 5,900 Health Issues values required imputation.

Feature Engineering

Converted categorical variables into usable numerical features.

Model Selection

Compared multiple approaches before selecting XGBoost.

Interpretation

Separated statistical significance from practical significance.

The report also discusses synthetic data, missingness, feature engineering decisions, and modeling tradeoffs as important limitations.

10 · Final insight

Look beyond the cup.

Although coffee consumption showed a statistically detectable association with stress, its practical effect was very small.

Sleep duration, sleep quality, health conditions, and age consistently explained stress levels much better than coffee intake.

11 · Skills demonstrated

Analysis with context.

Technical

Python · Pandas · Data Cleaning · EDA · Statistical Analysis · Hypothesis Testing · OLS Regression · XGBoost · SHAP · Seaborn · Matplotlib

Professional

Team Collaboration · Data Storytelling · Critical Thinking · Research · Analytical Communication · Problem Solving

12 · Reflection

This project taught me to distinguish statistical significance from practical significance.

I strengthened my ability to move beyond exploratory analysis and use statistical testing and machine learning to answer a real research question. I gained experience cleaning complex data, evaluating predictive models, interpreting results, and communicating evidence through clear visualizations.

Explore on GitHub
Next Project →GenAI LinkedIn Networking Assistant Person working on a computer