← Back to Projects Ann Arbor Hands-On Museum Expo poster

From Data to Decisions

Interactive Dashboards for Museum Engagement.

Helping the Ann Arbor Hands-On Museum transform attendance, membership, and donor data into actionable insights.

Role
Data Analyst • PM
Timeline
September 2025 – April 2026
Client
Ann Arbor Hands-On Museum
Team
5 Members
Tools
SQL • Apache Superset • Versai CRM • Excel

Overview

Background

The Ann Arbor Hands-On Museum serves over 300,000 visitors each year. Museum staff wanted an easier way to understand visitor engagement, membership activity, and donor trends so they could make more informed decisions.

Problem

Challenge

The museum's attendance, membership, and donor information was spread across multiple datasets.

This made it difficult to monitor visitor trends, understand membership growth, identify donor opportunities, and support outreach decisions.
Goal

Project Objective

  • Track attendance
  • Monitor memberships
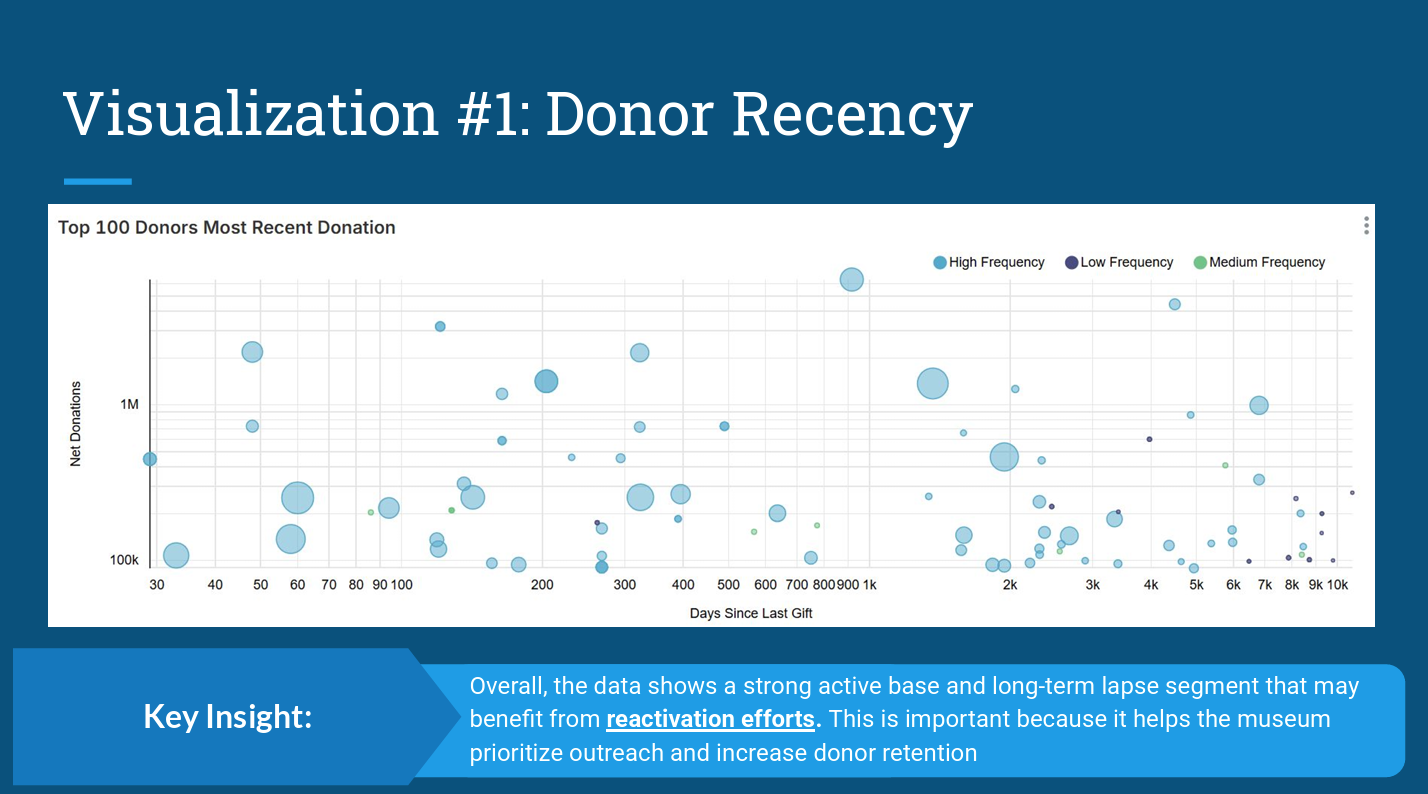
  • Analyze donor behavior
  • Support data-driven decision making

My Role

Responsibilities

Process

How we transformed museum data into interactive dashboards.

Research

We interviewed museum staff to understand their reporting challenges.

Data Cleaning

Validated visitor, membership, and donor data.

SQL Queries

Created reusable datasets and optimized queries.

Dashboard Design

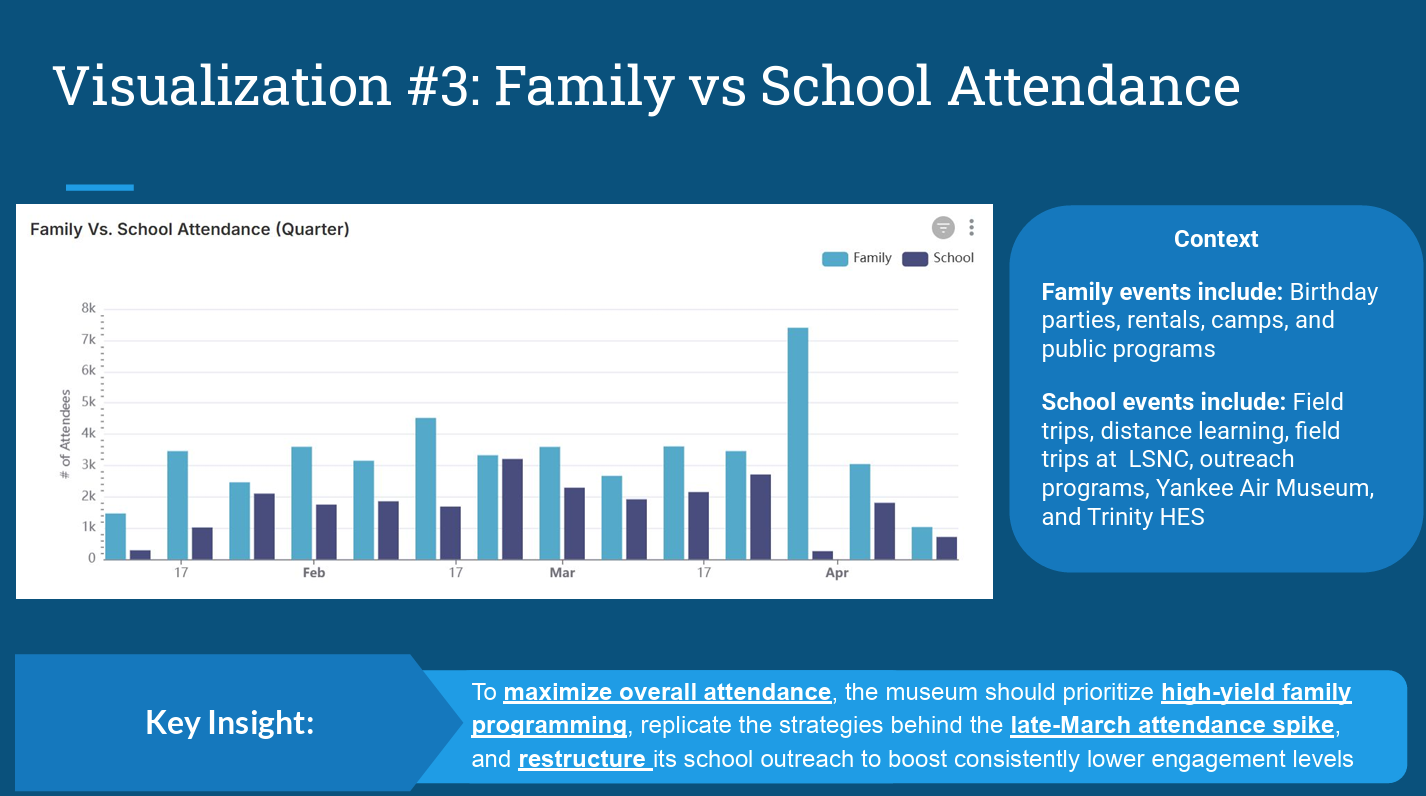
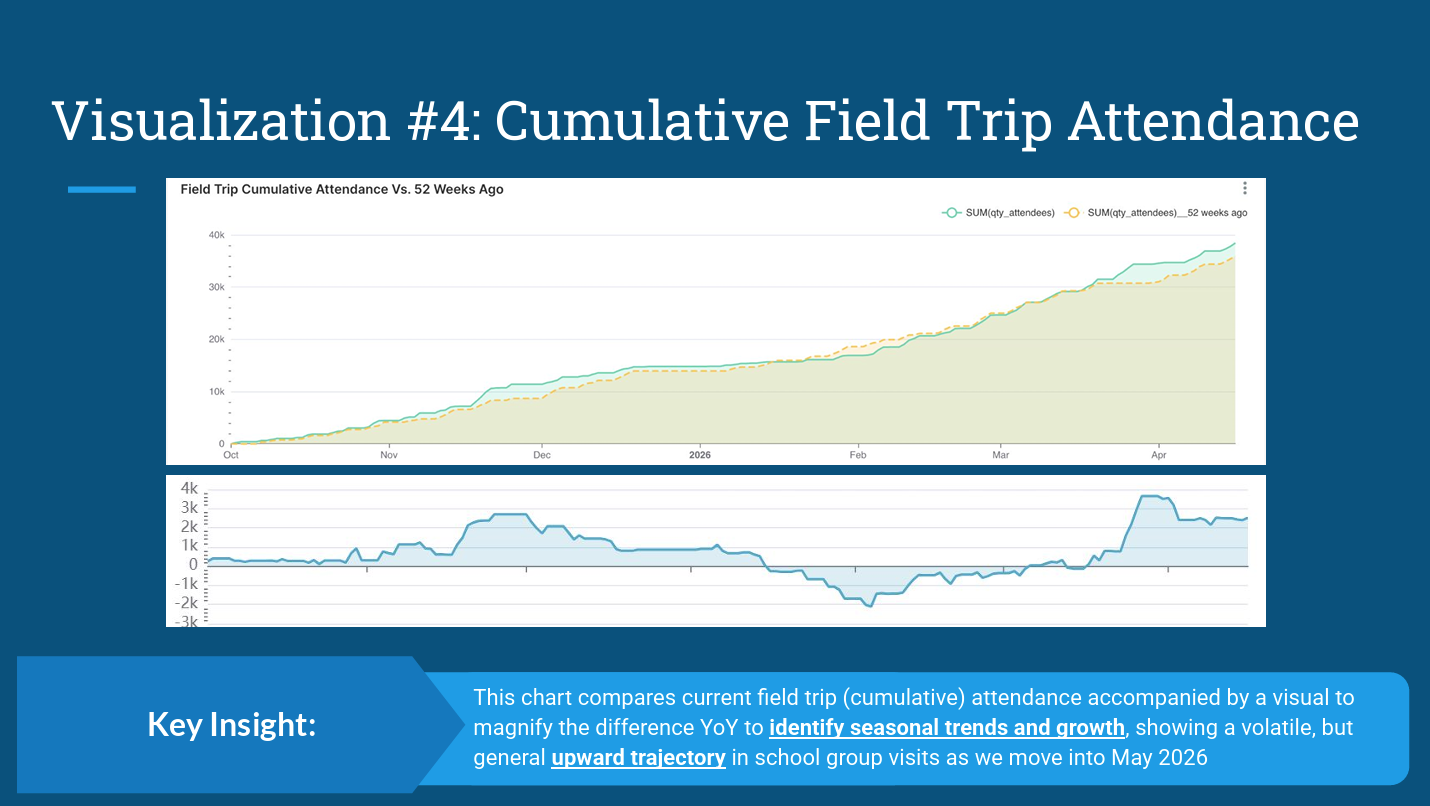
Built attendance, membership, and donor dashboards.

Testing

Collected client feedback and refined visualizations.

Delivery

Delivered dashboards, documentation, and training.

Design Decisions

Why these dashboards?

Results

Deliverables

  • Attendance Dashboard
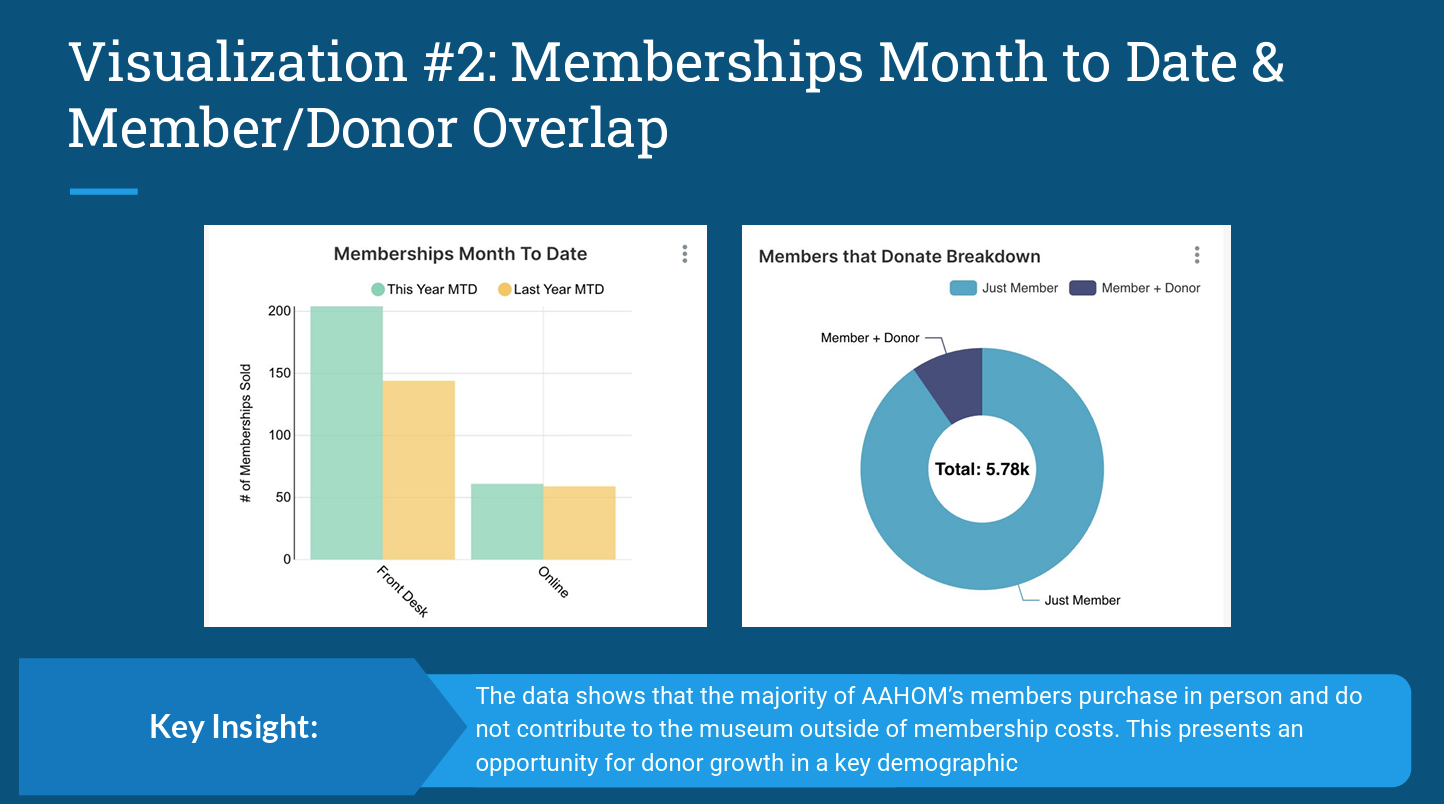
  • Membership Dashboard
  • Donor Dashboard
  • User Documentation
  • Data Refresh Guide
  • Client Presentation

Impact

What changed

The dashboards help museum staff monitor visitor engagement, improve outreach efforts, identify underserved communities, support fundraising, and make faster, data-informed decisions.

What I Learned

Skills strengthened

Skills Used

TechnicalSQLApache SupersetData CleaningDashboard DesignData Visualization
ProfessionalCommunicationTeamworkProblem SolvingClient CollaborationPresentation

Reflection

This project taught me that effective dashboards are more than attractive visualizations—they are decision-making tools. By collaborating with museum staff, our team transformed complex datasets into accessible insights that support community engagement and organizational planning.

Related Projects

Next Project →Movie Actor Collaboration Network Movie Actor Collaboration Network application